Gross profit is one of the most fundamental metrics in financial analysis, offering a clear breakdown of a company’s profitability from its core business operations.
Understanding the gross profit formula is crucial for businesses to develop future strategies for growth. It allows them to evaluate their market position and make informed business decisions, especially those concerning sales, budgets, and investments.
Also known as gross income or sales profit, gross profit is the amount a company earns after deducting the direct costs of producing and selling its goods or services. It is a key accounting metric businesses use to assess their financial health.
Simply put, gross profit is the difference between a company’s revenue and its cost of goods sold (COGS). When the gross profit figure grows, it indicates that a business is effectively managing operating expenses and generating more income.

Gross profit is the difference between a company’s revenue and its cost of goods sold (COGS). It is the amount a company earns after deducting the direct costs of producing and selling its goods or services.

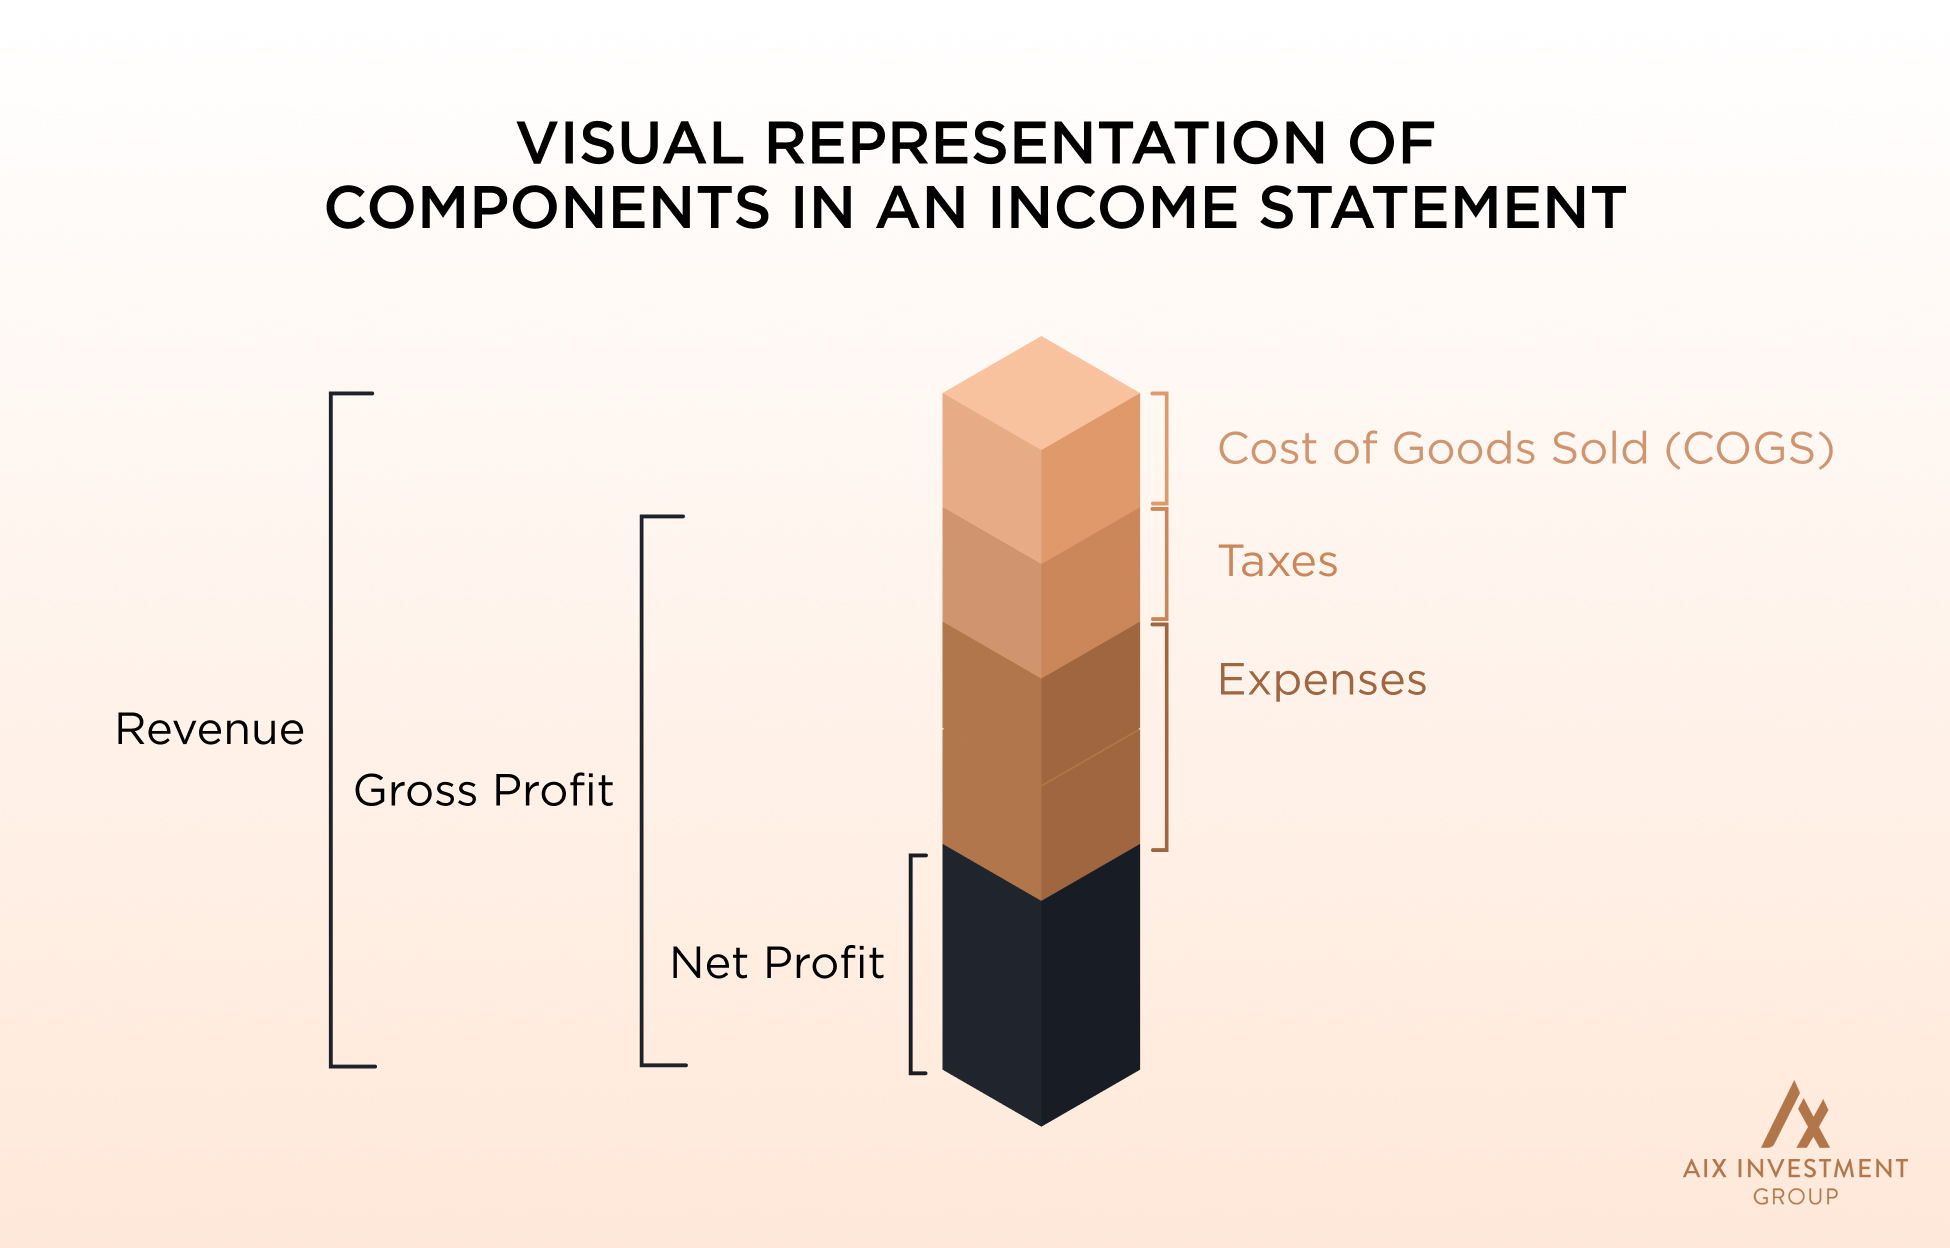
The total amount of money a company earns from selling their goods or services for the period. It is sometimes called net sales as it can include discounts and deductions from returned merchandise. Net revenue is also called top line because it is mentioned at the very top of the income statement.
Cost of goods sold, accounts for the direct expenses a company incurs when producing goods. It includes direct labor costs and any other cost of materials used within the production process of a company’s products.
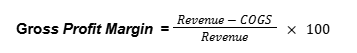
Gross Profit Margin is a financial metric that shows the percentage of revenue retained as profit after deducting the cost of goods sold (COGS). It indicates how efficiently a company produces and sells its goods.
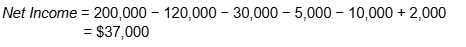
Net income, also called net profit, is the final profit of a company after all expenses are deducted from revenue. It assesses whether the business operation in general is profitable or not. Net income or net profit is sometimes referred to as “the bottom line” because it sits at the end of an income statement.

| AMOUNT (IN $) | |
|---|---|
| Revenue | 200,000 |
| Cost of Goods Sold (COGS) | 120,000 |
| Gross Profit | 80,000 |
| Operating Expenses | 30,000 |
| Interest Expenses | 5,000 |
| Taxes | 10,000 |
| Other Income | 2,000 |
| Net Income | 37,000 |
A fixed cost is an expense that remains constant regardless of the level of production or sales. These costs do not fluctuate with business activity in the short term.
Examples of fixed costs include:
Variable costs change based on production or sales volume. The higher the production or sales, the higher the variable costs, and vice versa.
Examples of variable costs include:
The gross profit formula, when using the absorption costing method, accounts for both fixed and variable costs involved in the production of goods. Under generally accepted accounting principles (GAAP), including fixed costs in the gross profit calculation is necessary for external financial reporting. This method assigns a portion of fixed costs to each unit produced.
In contrast, the variable costing method treats fixed costs as separate period expenses. Only variable costs are included in the computation of the cost of goods sold (COGS. This approach is commonly used for internal decision-making, as it provides a simple metric of the direct costs associated with production.
Example
If a factory produces 10,000 computers and pays $60,000 in rent for the building, a $6 fixed cost would be attributed to each computer under absorption costing. Variable costing would exclude rent from the COGS and deduct it separately in the income statement.
Comparing Gross Profit Totals Under Each Costing Method
Depending on whether a company uses absorption or variable costing methods, the gross profit figures will vary.
Since absorption costing takes into account both fixed and variable cost elements under COGS, the gross profit appears to be lower, as most costs are deducted.
On the other hand, as variable costing only deducts variable costs from COGS, gross profit appears to be higher.
Gross Profit vs. Gross Profit Margin
| Feature | Gross Profit | Gross Profit Margin |
|---|---|---|
| Definition | The absolute amount earned after subtracting COGS from revenue | The percentage of revenue remaining after deducting COGS |
| Formula | Revenue – COGS | Revenue – COGS(Gross Profit ÷ Revenue) × 100 |
| Result/ Metric | Expressed as a currency value | Expressed as a percentage |
| Purpose | Shows the total profit generated from sales before other expenses | Assesses production efficiency and profitability relative to revenue, indicating how well a company manages its production costs. |
| Analysis Over Time | Can increase with higher sales, even if production costs also rise. However, if production costs rise faster than sales, gross profit can decrease | The margin can decrease if production costs rise at a faster rate than sales revenue, indicating potential inefficiencies |
| Application in Decision-Making | Helps evaluate total earnings from sales | Helps analyze profitability trends and cost efficiency |
Example Calculation of Gross Profit and Gross Profit Margin
Let us assume the company has the following data:
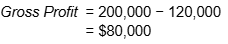
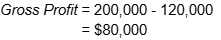
The results of the gross profit calculation show that the company has $80,000 remaining after covering the cost of producing the goods or services (COGS), before they account for other operating expenses such as taxes, interest, or administrative costs.
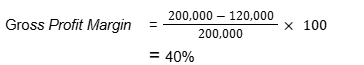
The gross profit margin of 40% shows the percentage of revenue remaining after the company covers the direct costs involved in producing its goods or services. It shows how efficient the company is in its production process and how much profit the company earns for each dollar of sales.
Gross Profit vs. Net Income
| Feature | Gross Profit | Net Income |
|---|---|---|
| Definition | Revenue minus the cost of goods sold (COGS) | Final profit after deducting all expenses from revenue |
| Purpose | Measures the efficiency of a company’s production and sales | Determines overall business profitability |
| Inclusion | Variable Costs | All expenses, including fixed costs, variable costs, operating expenses, and non-operating costs. |
| Also Known As | Gross income, sales profit | Net profit, bottom line, earnings. |
| Placement in Income Statement | Shown before operating expenses | The final figure at the bottom of the statement, representing the company’s total profit or loss. |

Having consistent growth in terms of gross profits indicates successful revenue strategies. Conversely, having a stagnant or declining gross profit signals the need for adjustments in your business model, indicating possible financial instability or inefficiencies.
Gross profit is a metric used to understand how well a business strategy performs in production and sales.
Successful investors and financial advisory firms use gross profit as an essential metric to assess a company’s profitability. A company that consistently grows its gross profit is generally seen as a more attractive investment for investors, shareholders, and financial institutions. This signals strong revenue generation and efficient cost management.
Gross profit specifically examines a company’s revenue and the direct costs involved in producing goods or services. This straightforward metric offers a clear insight into the profitability of individual products or services, allowing businesses to evaluate performance and identify areas where they can cut costs and improve overall efficiency.
Gross profit tends to be less complicated than net profit because it does not involve fixed expenses like rent, administrative costs, and taxes. This allows businesses to adjust their pricing and manage production costs more efficiently to optimize profitability.
Gross profit as a financial metric helps businesses make strategic decisions that enable them to rebalance portfolios, drive long-term growth, and maximize earnings.
Gross profit figures can vary depending on the accounting methods used, the format of financial statements, and how costs are classified. In some income statements, gross profit is clearly shown as a separate line item, while in others, it may be included within broader financial data that requires more detailed analysis.
Financial statements of private companies may follow non-standardised formats that do not always include gross profit calculations. Investors must carefully review cost and expense items to gain a complete understanding of a company’s financial health.
While gross profit provides a clear overview of sales performance and strategy, it doesn’t flag inefficiencies within the business. To uncover the root causes of underperformance, businesses often need to conduct a deeper analysis with the help of a financial expert. For example, if a company’s gross profit is 15% lower than that of its competitor, it should analyze all revenue streams and each component of COGS to identify the problem areas.
Gross profit can sometimes be misleading or confusing for companies that offer intangible services. For instance, a law firm with no cost of goods sold will report a gross profit equal to its revenue, which doesn’t provide an accurate reflection of its financial health or operational efficiency.

Gross profit is also a key financial metric that plays a crucial role in helping investors evaluate a wide range of investments and asset classes for operational efficiency and profitability potential.
While gross profit is applicable and more relevant to some investments than others, in general, it provides valuable insights into how well a business or investment generates income relative to its cost incurred for key business activities.
Here is a simple breakdown of some common types of investments and how gross profit can support profitability analysis and decision-making.
While investors generally use metrics like net operating income (NOI) and capitalization (cap) rates to assess returns in real estate, they can make more informed decisions after comparing gross profit to direct costs, which can provide valuable insight into inefficiencies.
Understanding the gross profitability of a property helps gauge its ability to generate positive cash flow before considering debt services such as mortgage payments and taxes. To calculate the gross profit of a rental property, deduct direct expenses, such as property management, maintenance, and other utilities paid by the landlord, from the rental income.
Fixed-income securities use the issuer’s gross profit as part of the assessment when evaluating the creditworthiness of a company, as it is useful in understanding how well the company is managing its core business operations. It is not used to evaluate the bond itself. Though it’s not as central or comprehensive as other metrics like EBITDA or free cash flow, gross profit is still considered an important factor, as it helps gauge operational efficiency and profitability.

Gross profit is fundamental to analyzing deeper profitability that drives stock valuations (e.g., P/E ratios EV/EBITDA multiples). It helps investors assess a company’s operational efficiency and its ability to scale. Meanwhile, gross profit margin provides insights into the company’s competitive advantage and pricing power.
An improving gross profit signals promising growth potential, while strong pricing power means a company can increase its prices without losing customers or sales volume. In contrast, weak pricing power suggests that raising prices could cause customers to switch to competitors.
A strong gross profit indicates a viable and feasible business model. Startups or medium-sized companies may often have a negative income due to high overhead or expansion costs. In such cases, investors focus on gross profit margins to determine if the core business can become profitable once scaled.
In private equity, gross profit plays a crucial role in evaluating whether operational improvements can drive future profitability.
Financial experts and advisory firms use gross profit as a key metric to quickly assess how well a company’s core activities are performing after covering direct expenses.
Gross profit helps professional financial advisors evaluate the financial health of a company, analyze operational strengths and inefficiencies, and identify opportunities for profitable investments. Additionally, gross profit is used to make recommendations on pricing strategies, cost control, and investment decisions.
Simply put, financial experts and advisors rely on gross profit as a reliable indicator to evaluate the profitability of an investment. It also helps them guide clients on whether an investment is likely to offer higher returns with manageable risk or if it carries a high-risk profile.
Deducting the total cost of goods sold (COGS) from the total revenue, or net sales, gives a company’s gross profit. The calculation is done by applying the gross profit formula, where:
Gross profit = Revenue- Cost of goods sold (COGS).
Gross profit increase is determined by comparing the gross profit from one period to another. The formula to calculate the gross profit increase is:
Gross Profit Increase (%) = [(Current Gross Profit − Previous Gross Profit) ÷ Previous Gross Profit] × 100
The basic formula to calculate the profit is to deduct the cost price from the selling price (Profit = Selling Price – Cost Price). In this formula, the Cost Price (CP) of a product refers to the cost at which it was originally bought.
Having a 40% or higher gross profit margin can act as a buffer to manage overheads and cash flow. Trying to keep overheads at around 20 to 25% can result in a net profit of at least 15%, indicating a strong business, especially in industries with higher production costs. This can vary from one industry to another. Maintaining a wide gap between gross profit margin and working capital percentage helps release cash as the business grows, preventing cash shortages.
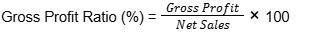
The gross profit ratio is commonly referred to as the gross profit margin. Dividing the gross profit figure by the total net sales will give the gross profit ratio. It can also be expressed in percentage form, multiplying the result by 100. The formula to find the gross profit ratio/margin in percentage is:
Overview